Manual Chapter :
Viewing DDoS Reports Statistics and Logs
Applies To:
Show Versions
F5 DDoS Hybrid Defender
- 13.1.0
Investigating DoS attacks and mitigation
You can use the DoS Dashboard screen
for an overview of DoS attack activity on your BIG-IP® system, and
corresponding system information during DoS attacks.
-
To view more details of your DoS activity, click .
Tip: From the Dashboard, you can automatically filter specific Attack IDs or Virtual Servers in the DoS Analysis screen, by selecting the chart icon (
 ) from a table row.
You can continue to review the system
snapshot using the DoS Dashboard screen. As a result, you become more familiar with you
system's activities during DoS attacks. You can also view the statistics in graphical
charts and in tables, focusing on the specific data you need using attack and dimension
filters.
Sample DoS Dashboards
This figure shows a sample DoS Dashboard on a system that is having a low-level DoS attack now.
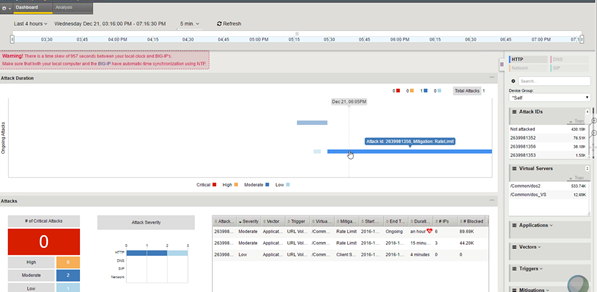
Sample DoS Dashboard
This figure shows a sample DoS Dashboard showing DoS attacks that occurred during the last week. Three of the attacks were critical but all were mitigated within minutes.
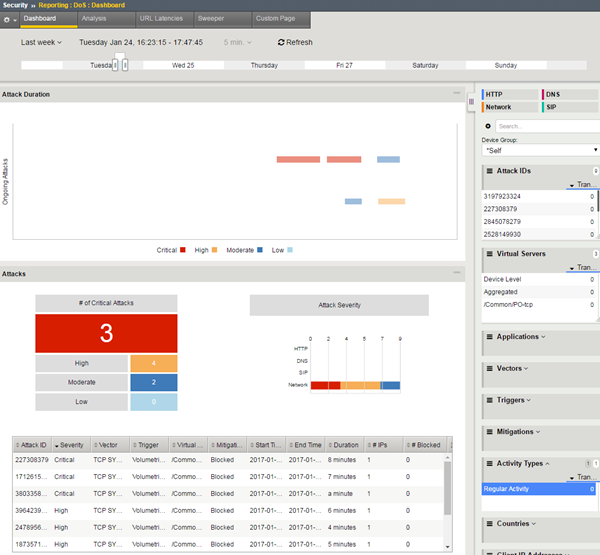
Sample DoS Dashboard showing attacks
Displaying DDoS Event logs
You can display DoS Event logs to
see whether DDoS attacks have occurred, and view information about the attacks. The logs
show details about the DDoS events.
Displaying DoS Application Events logs
You can display DoS Application Events logs to see whether L7 DoS attacks have
occurred, and view information about the attacks. The logs show details about the DoS
events.
Creating customized DoS reports
You can create a customized DoS reporting screen so that it shows the specific data
you are interested in, such as the top DoS attacks and server latency.
You have created a custom page that includes the information you need to monitor
your system. As you use the reports to investigate DoS attacks, you can adjust the
custom page to include additional data that you need. You can save the reports or send
them to others who want to review the data.


