Applies To:
Show Versions
BIG-IP ASM
- 11.6.5, 11.6.4, 11.6.3, 11.6.2, 11.6.1
Viewing DoS reports, statistics, and logs
Overview: Viewing DoS reports, statistics, and logs
If you have configured DoS protection on the BIG-IP® system, you can view charts, reports, statistics, and event logs that show information about DoS attacks and mitigations in place on the system. For example, you can view a DoS Overview Summary screen that shows at a glance whether or not the system is under attack. The Overview Summary also indicates the impact of DoS attacks on the server's throughput, and RAM and CPU usage.
Other reports show DoS statistics, and correlate the impact of system detection and the mitigation of DoS attacks. The reports and event logs help you to understand whether the DoS protection you have implemented is protecting your application web site, or whether you need to fine-tune the configuration. You can use the information to provide the intelligence necessary to identify and track DoS attacks. By looking at historical attacks and their trends, you can gain insight on the DoS threats the web site is facing.
You can also define custom reports based on dimensional queries.
Investigating DoS attacks and mitigation
Sample DoS Overview Summary
This figure shows a sample DoS Overview Summary showing a system that is operating normally. The statistics will vary from system to system, and it is a good idea to get familiar with typical memory and CPU usage and throughput on your system.
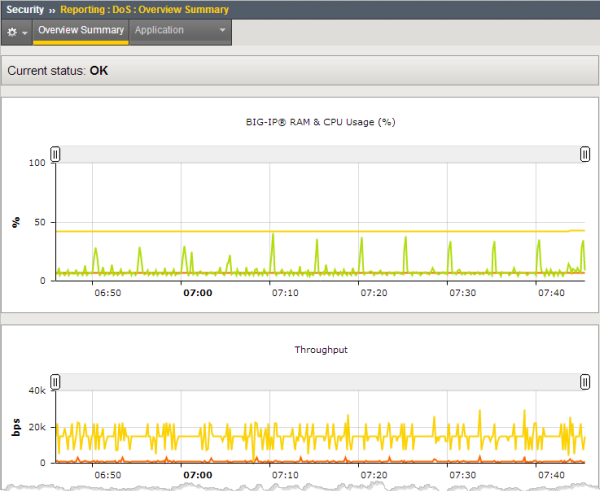
Sample DoS Overview Summary (no DoS attacks)
This figure shows a sample DoS Overview Summary showing a system that is currently under attack. The system has 1 ongoing attack as shown in the current status.
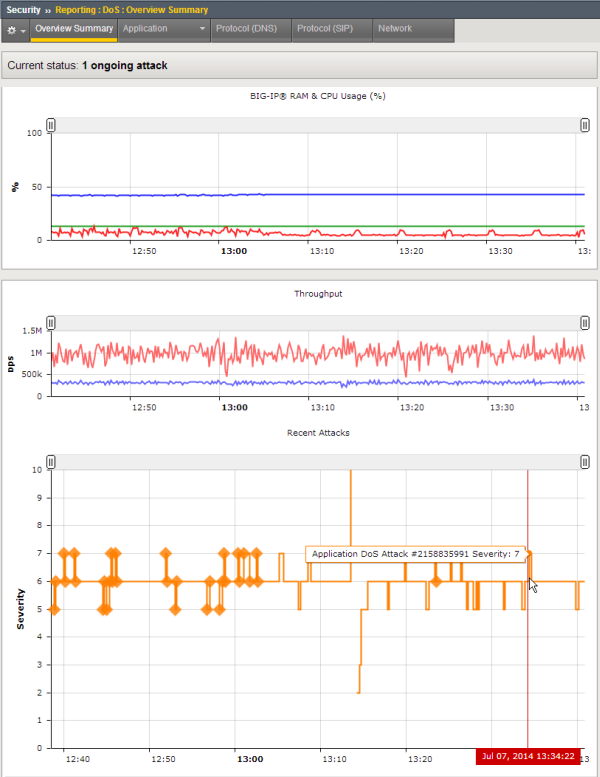
Sample DoS Overview Summary (system under attack)
In the Recent Attacks table, each attack is displayed with the duration of the attack on the X-axis, and the severity of the attack on the Y-axis. The Severity shows the impact of the DoS attack on your system, and it correlates with the average latency of the server. The Severity is measured from 0-10, where 0 has the least impact and higher numbers have greater impact. In this case, the impact is fairly high averaging between 5 and 7.
Click the Recent Attacks table to view statistics about the attack.
Viewing DoS application statistics
Traffic distribution in DoS application statistics
When displaying DoS application statistics, the charts classify the traffic into the following traffic types.
| Traffic type | What it means |
|---|---|
| Incomplete | Traffic that was dropped by the server because the connection was incomplete or the server did not respond. |
| Blocked | Traffic that was blocked as a result of the prevention policy (with rate limiting set using request blocking) in the DoS profile. |
| Proactive Mitigation | Traffic that did not respond to a JavaScript challenge, which was sent due to using Proactive Bot Defense in the DoS profile. So it is potentially a web robot. |
| CAPTCHA Mitigation | Traffic that did not respond to a CAPTCHA challenge or responded incorrectly. The challenge is specified in the prevention policy of the DoS profile. |
| CS Integrity Mitigation | Traffic that did not respond to a JavaScript challenge, which was sent as a result of the prevention policy (set using client-side integrity defense options) in the DoS profile. |
| BIG-IP Response | Traffic that is a response to the client from the BIG-IP® system. |
| Cached by BIG-IP | Traffic that is served from cache configured in the Web Acceleration profile. |
| Whitelisted | Traffic from IP addresses on the IP Address whitelist in the DoS profile. |
| Passthrough | Traffic that is allowed because it does not constitute a DoS attack. |
In the lower table, Latency (ms) indicates how long it takes (in milliseconds) from the time a request reaches the BIG-IP system, for it to proceed to the web application server, and return a response.
Sample DoS Statistics reports
This figure shows a sample DoS Statistics report for a system on which there has been DoS attacks for the past week. The chart shows how the traffic has been handled by the system. It shows aggregated data that is updated every few minutes. A large percentage of the attacking requests have been blocked according to the prevention policy specified in the DoS profile (this policy uses Request Blocking with source IP and URL-based rate limiting). During normal traffic patterns, you typically see more passthrough traffic, and less traffic that was blocked.
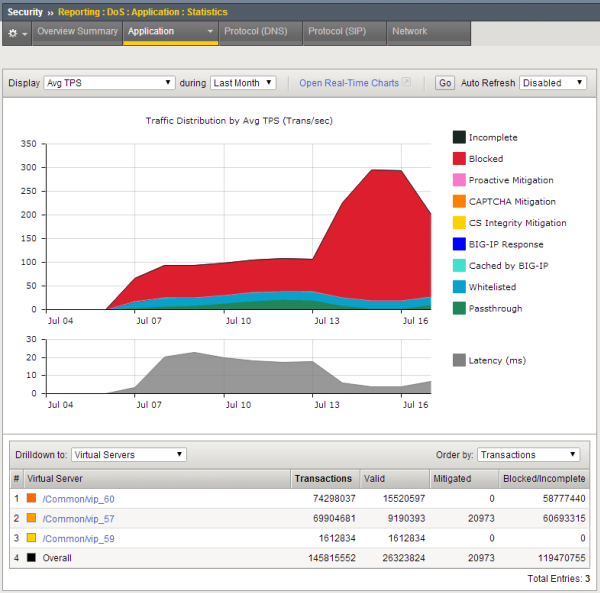
Sample DoS Statistics report
You can adjust which elements are listed in the table below the chart. In this figure, the virtual servers traffic is attempting to access are listed. By clicking one of the virtual servers (or other objects listed), you can drill down to see what is happening with that specific traffic. For example, here the trouble is on vip_60 and vip_57where attacks are taking place, and some of the traffic is being blocked.
You can also open a real-time chart that is constantly updated by clicking the Open Real-Time Charts link. It is a popup screen that you can leave displayed on your computer. It shows the traffic distribution on the system. Here much of the traffic is being blocked (shown in red), some is from IP addresses on the whitelist in the DoS profile (shown in turquoise), and the remaining traffic is allowed to pass through the system (shown in green).
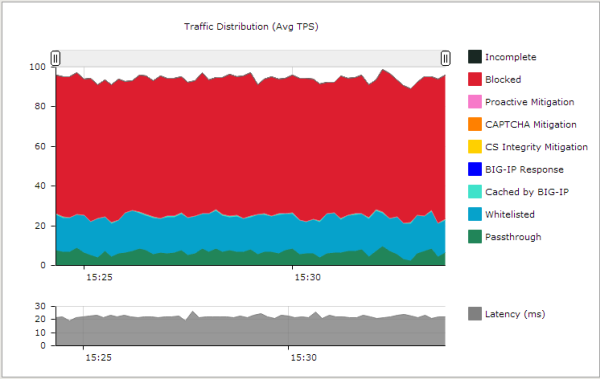
Sample DoS real-time chart
You can go back to the DoS Statistics report and change the values for what is displayed using the Display and during settings, and open another real-time chart to see additional information. Viewing different statistical views is useful to understanding and tracking DoS attacks.
Displaying DoS event logs
Sample DoS event logs
This figure shows a sample DoS Application Attacks event log for a system that has had quite a few DoS attacks over the past few days. You can see that they have been mitigated using rate limiting, and all have ended. By clicking the down-arrow on the left of the attack ID, you can display details as shown for the first entry.
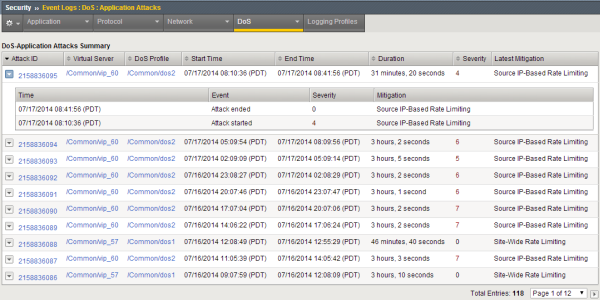
Sample DoS Application Attacks event log
This figure shows a sample DoS Application Events log showing information about the events related to the DoS attacks, such as when the attack started and finished, how it was mitigated, the IP address where it originated, the transactions per second during the attack indicating the latency of traffic to the web application, and the attack ID.
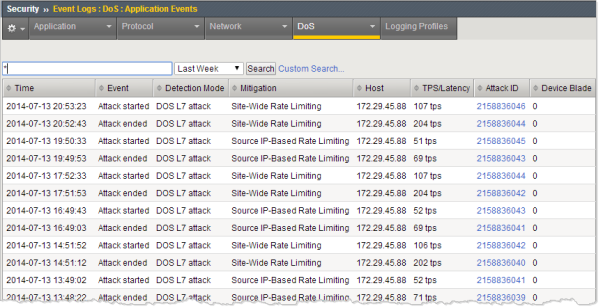
Sample DoS Application Events log
You can click the attack ID to display DoS application statistics for the attack.
Viewing URL Latencies reports
The URL Latencies report shows how fast your web application returns web pages and can show typical latency for applications (meaning virtual servers associated with a DoS profile) on your system. It can help you to identify slow pages with latency problems that may require additional troubleshooting by application developers.
You can also use the URL Latencies report for the following purposes:
- To determine the threshold latencies, especially the heaviness threshold. Tip: Set the heaviness threshold to approximately 90-95% of the latency distribution for the site. Filter the data by site (that is, by virtual server and DoS profile), and check the latency distribution in the histogram of the Total row.
- To track the current heavy URLs. You can add or remove manually configured heavy URLs depending on the information in the report.
- To monitor the latency distribution.
Sample URL Latencies report
This figure shows a sample URL Latencies report for a system that has two DoS profiles and two virtual servers. It shows the latency for several web pages ranging from 10.97 ms to 2006.07 ms. One page (/DOS/latency2.php) has very high latency and might require some troubleshooting. In this case, the system determined that URL to be "heavy" based on traffic. While investigating the latency of URLs that take longer to display, if it is acceptable, you may decide to add them to the list of heavy URLs in the DoS profile so they do not trigger DoS mitigation.
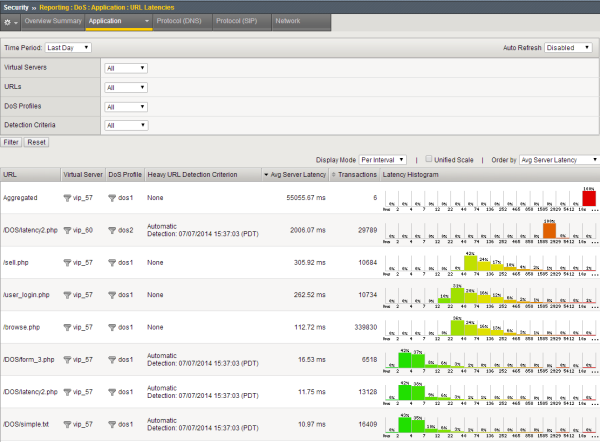
Sample URL Latencies report


