Applies To:
Show Versions
BIG-IP ASM
- 11.6.5, 11.6.4, 11.6.3, 11.6.2, 11.6.1
Displaying Reports and Monitoring ASM
ASM Reporting Tools
You can use several reporting tools in Application Security Manager ™(ASM) to analyze incoming requests, track trends in violations, generate security reports, and evaluate possible attacks. The statistics and monitoring reporting tools are described in this table.
| Reporting Tool | Description |
|---|---|
| Application security overview | Displays a summary of all configured security policies showing the active security policies, attacks that have occurred, anomaly statistics, and networking and traffic statistics. You can save the information or send it as an email attachment. |
| Requests summary | Summarizes the requested URLs for security policies. |
| Event correlation | Displays a list of incidents (suspected attacks on the web application). Requests become incidents when at least two illegal requests are sent to the web application within 15 minutes, and the system groups them according to criteria. The criteria concern illegal requests for a specific URL, a specific parameter, or a specific source IP address. |
| Charts | Displays graphical reports about security policy violations and provides tools that let you view the data by different criteria, drill down for more data, create customized reports, and send or export reports. |
| Charts scheduler | Allows you to periodically generate specific reports and distribute them using email. |
| DoS Attacks report | Displays graphic charts about DoS attacks, viewed by selected category, and includes the attack start and end times. |
| Brute Force Attacks report | Displays graphic charts about brute-force attacks, viewed by selected category, and includes the attack start and end times. |
| Web Scraping statistics | Displays graphic charts about web scraping attacks, viewed by selected category, and includes the attack start and end times. |
| Session Tracking status | Displays the users, sessions, and IP addresses that the system is currently tracking, and for which the system is taking action as a result of having triggered one of the violation detection thresholds. |
| PCI Compliance report | Displays a printable Payment Card Industry (PCI) compliance report for each security policy showing each security measure required for PCI-DSS 1.2, and compliance details. |
| CPU Utilization report | Displays the amount of the available CPU that the Application Security Manager uses over a period of time. |
Displaying an application security overview report
Analyzing requests with violations
Ways to analyze a request
To see if any violations have recently occurred, you can examine the event log called the Requests List. It is a good idea to look for spikes and irregular behavior in the Requests List because these usually indicate suspicious activity. As shown in the following figure, you may see a high-rated request within a stream of low-rated (or even legal) requests.
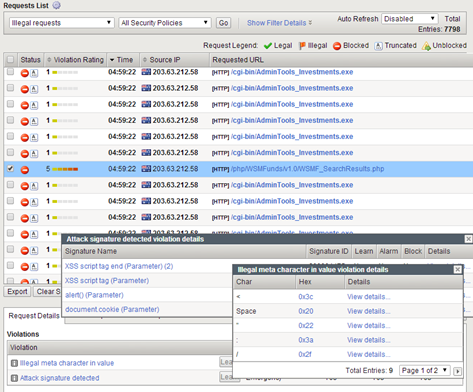
Sample Requests List with irregular behavior
In the next example, the enforcement mode of the security policy is set to blocking. In this Requests List, which shows only illegal requests, several requests from one source IP are being blocked.
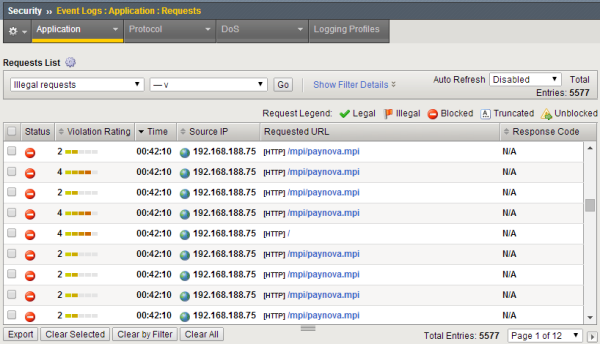
Sample Requests List with illegal requests
The violation ratings indicate how likely a request is to be an attack (4 or 5) or a false positive (1 or 2).
To find out about a particular request, select the check box on the left. The system then displays request details and violations. This request is rated a 4 so you decide to see what the problem is. There are three violations.
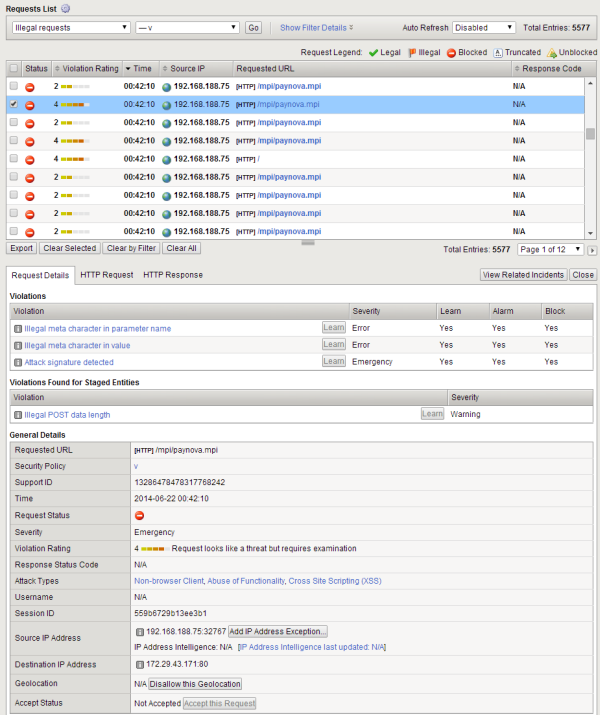
Sample request—general details
You can display details about the violation by clicking it, and drill down further. Here we look at the Illegal meta character in parameter name violation. It does not look that serious.
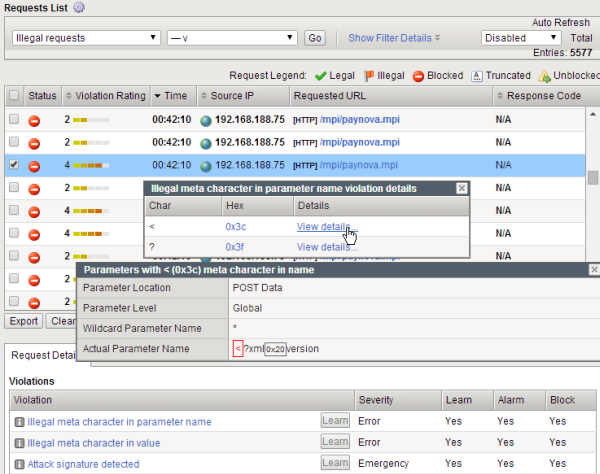
Illegal meta character details
You can examine the other violations to see whether they constitute an attack on your web application, or whether they are legitimate users.
If you need more information, you can look at the actual contents of the request by clicking HTTP Request.
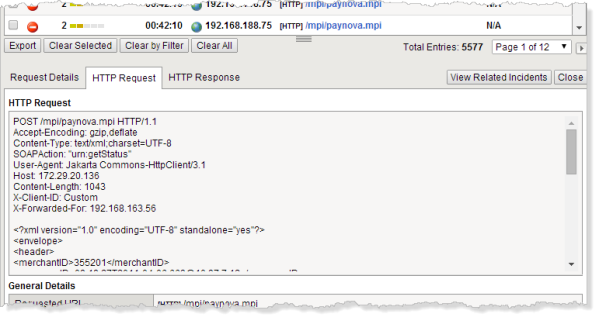
Sample request—code
You can further analyze the Requests List by filtering the data by a specific IP address, and seeing if patterns related to a specific client emerge.You can get a clearer picture of the clients, for example, in a busy and noisy site, where there is a lot of traffic and violation log entries.
Creating a report containing selected requests
Generating PCI Compliance reports
Sample PCI Compliance report
This sample PCI Compliance report examines the security policy called phpauction_2. It shows five requirements that do not comply with PCI-DSS 3.0 (marked with red Xs). Application Security Manager™ has settings that support bringing these requirements into compliance.
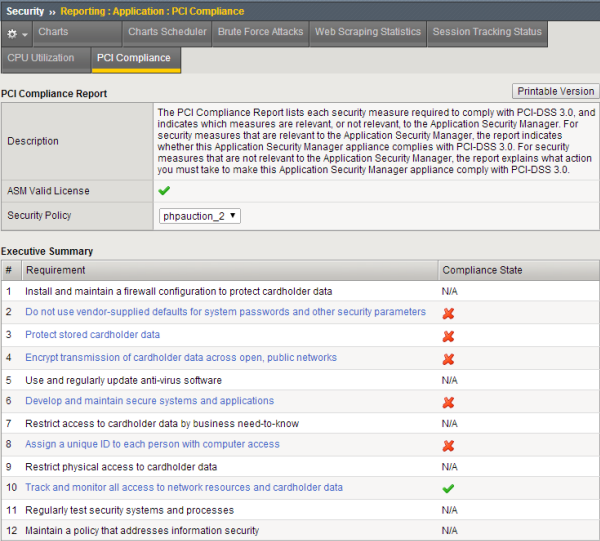
Sample PCI Compliance report


