Applies To:
Show Versions
The VIPRION® 2400 Platform
About the platform
The VIPRION® 2400 system provides you with the flexibility and feature-rich capabilities of F5® products on a powerful and highly-extensible hardware platform. With this platform, you install and configure multiple F5 products using hot-swappable blades. This provides you with the ability to add, remove, or change the platform's configuration to best fit your network. Many components are available for you to add, remove, or change including the blades, power supplies, fan tray, and more. This configuration allows for an extremely robust and flexible system that can manage large amounts of application traffic, and remain operational even if one of its components goes offline.
VIPRION platforms include two types of components: blades, which provide the hardware and software needed to manage network traffic, and a chassis, which houses the blades.
The VIPRION 2400 platform supports either AC or DC power. If you ordered DC power as a factory option, the platform comes pre-installed with DC power supplies. If you ordered DC power supplies from F5 as an upgrade to an AC-powered platform, you have to switch out the AC power supplies for DC power supplies.
Although the VIPRION 2400 platform is highly extensible and designed to be easy to implement, familiarity with the platform components can help ensure that you install and integrate the platform successfully and effectively.
About the chassis
The chassis is the housing unit that contains all of the components necessary for the VIPRION® 2400 platform to operate effectively.
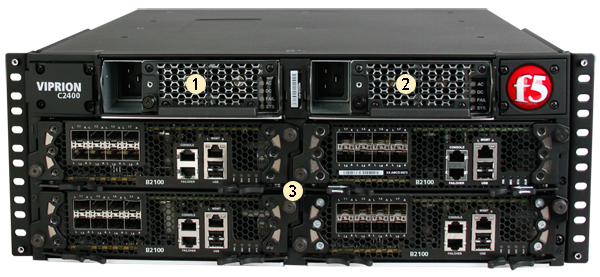
Front view of a VIPRION C2400 chassis with four blades installed and pre-installed two-point rack mounting brackets
- Power supply 1
- Power supply 2
- Blades (1-4)
The fan tray is on the back of the chassis.
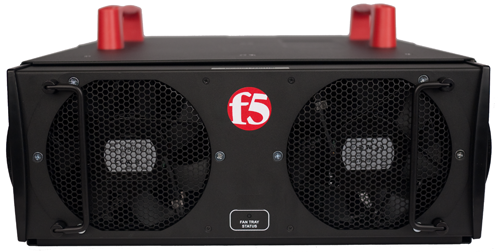
Back view of the chassis
About the blades
A blade is the primary component that handles the traffic management within the VIPRION® platform. You can install up to four blades in a VIPRION 2400 chassis. These blades comprise a group, known as a cluster. The chassis includes blanks in the slots where blades are not installed.
Blanks must be installed in all unused slots, as they help ensure proper airflow within the chassis and EMI compliance of the unit.
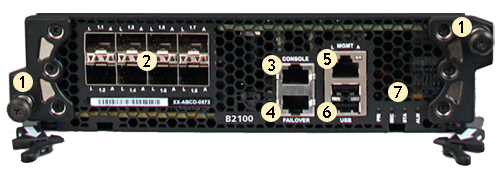
Front view of the B2100/B2150 blade
- Captive screws
- SFP+ ports (8)
- Console port
- Serial (hard-wired) failover port
- Management port
- USB ports (2)
- Indicator LEDs
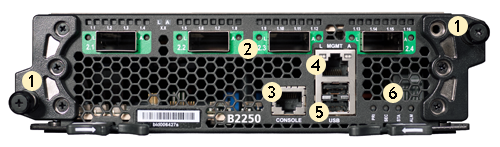
Front view of the B2250 blade
- Captive screws
- 40GbE ports (4)
- Console port
- Management port
- USB ports (2)
- Indicator LEDs
USB LCD module
An external USB LCD module is available for use with the VIPRION 2000 Series platform.
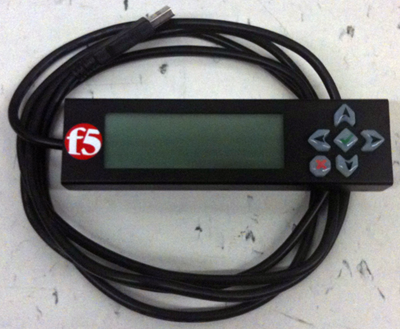
USB LCD module
Using the USB LCD module
Pausing on a screen
Clearing alerts
Indicator LEDs
The VIPRION® 2400 platform includes indicator LEDs in three locations: on the individual blades, on the power supplies, and on the fan tray.
Indicator LED actions
The behavior of the LEDs indicate system or component status.
| Action | Description |
|---|---|
| Off (none) | LED is not lit and does not display any color. |
| Solid | LED is lit and does not blink. |
| Blinking | LED turns on and off at a regular frequency. |
| Intermittent | LED turns on and off with an irregular frequency and might appear solid. |
Blade indicator LEDs
The blade LEDs indicate whether the blade is a primary or secondary blade, and show alarm and blade status.
| LED | Status |
|---|---|
| Primary | Indicates that the blade is a primary blade for a cluster. |
| Secondary | Indicates that the blade is a secondary blade for a cluster. |
| Status | Indicates the state of the system. |
| Alarm | Indicates a non-specific alert level. Use SNMP traps, system logs, or the LCD display for more information. |
Blade standard operating states
The blade LEDs indicate the operating state of a blade.
| System state | Primary LED (PRI) | Secondary LED (SEC) | Status LED (STA) | Alarm LED (ALM) |
|---|---|---|---|---|
| Active mode | Off/None | Off/None | Green solid | Off/None |
| Powered off | Off/None | Off/None | Off/None | Off/None |
Blade LED status conditions
The blade LEDs indicate specific operating conditions, such as high availability (HA) status, or when a blade is shut down, reset, or not properly seated.
| Blade state | Primary LED | Secondary LED | Status LED | Alarm LED |
|---|---|---|---|---|
| Blade is fully functional and operating as the primary in a high availability (HA) configuration | Green solid | Off/None | Green solid | Off/None |
| Blade is fully functional and operating as a secondary in a high availability (HA) configuration | Off/None | Yellow solid | Green solid | Off/None |
| User-initiated blade power down | Green blinking | Green blinking | Green blinking | Off/None |
| Blade shut down due to thermal overtemp limit | Yellow blinking | Yellow blinking | Yellow blinking | Red solid |
| Blade not seated properly | Yellow blinking | Yellow blinking | Yellow solid | Red solid |
| Power supply inserted, but not supplying power | N/A | N/A | N/A | Red solid |
Fan tray indicator LED
The fan tray LED indicates the status of the fan tray.
| Action | Status |
|---|---|
| Yellow solid | Indicates that either the fan tray controller is powering on, or one or more fans are not spinning within the specified RPM range. |
| Green solid | Indicates that the fan tray controller is fully functional, and all fans are spinning within the specified RPM range. |
AC power supply indicator LEDs
The AC power supply LEDs indicate the status of the power supply and power input.
| LED | Status |
|---|---|
| AC | Indicates that AC input voltage is operational (on) or non-functioning (off). |
| DC | Indicates that DC output voltage is operational (on) or non-functioning (off). |
| FAIL | Indicates these conditions:
|
| SYS | Indicates these conditions:
|
DC power supply indicator LEDs
The DC power supply LEDs indicate the status of the power supply and power input.
| LED | Status |
|---|---|
| IN | Indicates that DC input voltage is operational (on) or non-functioning (off). |
| OUT | Indicates that DC output voltage is operational (on) or non-functioning (off). |
| FAIL | Indicates these conditions:
|
| SYS | Indicates these conditions:
|
LED alert conditions
The Alarm LED indicates when there is an alert condition on the system.
| Action | Description |
|---|---|
| System situation | Alarm LED behavior |
| Emergency | Red blinking |
| Alert or Critical | Red solid |
| Error | Yellow blinking |
| Warning | Yellow solid |
Defining custom alerts
Platform interfaces
Every platform includes multiple interfaces. The exact number of interfaces that are on the system depends on the platform type.
Each interface on the platform has a set of properties that you can configure, such as enabling or disabling the interface, setting the requested media type and duplex mode, and configuring flow control.
About blade interfaces
B2100 Series blades
The B2100 Series blades have eight 10GbE SFP+ optical interfaces that are connected internally. The SFP+ connectors can each support 10G speed with an F5®-branded optical SFP+ module or 1000 Mbit speed with an F5-branded optical SFP 1GbE module installed.
B2250 blade
The B2250 blade has four 40GbE QSFP+ fiber interfaces that support up to four 40GbE ports (2.1-2.4), which you can use as individual 10GbE ports or as 40GbE ports, depending on how you bundle the ports. There are LEDs for both 10GbE and 40GbE operation.
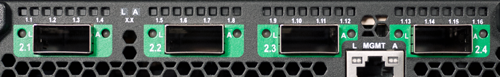
B2250 blade interfaces and LEDs
Supported transceivers
For current specification information for optical transceivers that are supported by this platform, see F5® Platforms: Accessories.
About 40GbE interfaces
On VIPRION® platforms that include 40GbE interface ports, you can use the ports as a single 40GbE port or as four 10GbE SFP+ ports.
40 GbE QSFP+ components
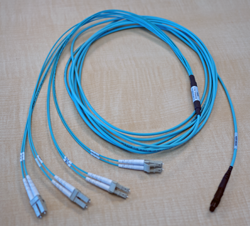
An example of a 40 GbE QSFP+ breakout cable
You can order these 40 GbE QSFP+ components from F5®:
- QSFP+ breakout cables (MTP to LC), provided as a pair, in these
lengths:
- 1 meter (F5-UPG-QSFP+-1M-2)
- 3 meter (F5-UPG-QSFP+-3M-2+)
- 10 meter (F5-UPG-QSFP+-10M-2)
- F5-branded 40GbE QSFP+ transceiver modules (F5-UPG-QSFP+ and F5-UPG-QSFP+LR4)
Configuring bundling for 40GbE interfaces using tmsh
Configuring bundling for 40GbE interfaces using the Configuration utility
About managing interfaces
You can use tmsh or the Configuration utility to configure platform interfaces.
Viewing the status of a specific interface using tmsh
Viewing the status of all interfaces using tmsh
Viewing the status of all interfaces using the Configuration utility
About interface media type and duplex mode
All interfaces on the system default to auto-negotiate speed and full duplex settings. We recommend that you also configure any network equipment that you plan to use with the system to auto-negotiate speed and duplex settings. If you connect the system to network devices with forced speed and duplex settings, you must force the speed and duplex settings of the system to match the settings of the other network device.
By default, the media type on interfaces is set to automatically detect speed and duplex settings, but you can specify a media type as well. Use the following syntax to set the media type:
tmsh modify net interface <interface_key> media <media_type> | auto
If the media type does not accept the duplex mode setting, a message appears. If media type is set to auto, or if the interface does not accept the duplex mode setting, the duplex setting is not saved to the /config/bigip_base.conf file.
Valid media types
These media types are valid for the tmsh interface command.
| 10BaseT half | 10GBaseLR full |
| 10BaseT full | 10GBaseER full |
| 100BaseTX half | 10SFP+Cu full |
| 100BaseTX full | 40GBaseSR4 full |
| 1000BaseT half | 40GBaseLR4 full |
| 1000BaseT full | 100GbaseSR4 full |
| 1000BaseSX full | 100GbaseLR4 full |
| 1000BaseLX full | auto |
| 1000BaseCX full | none |
| 10GBaseT full | no-phy |
| 10GBaseSR full |
Viewing valid media types for an interface
Network interface LED behavior
The appearance and behavior of the network interface LEDs on the blades indicate network traffic activity, interface speed, and interface duplexity.
SFP+ port LED behavior
The appearance and behavior of the SFP+ optical interface LEDs indicate network traffic activity, interface speed, and interface duplexity.
| Blade type | Link | Speed LED | Activity LED |
|---|---|---|---|
| B2100/B2150 | No link | Not lit | Not lit |
| B2100/B2150 | 1Gbit/s, half duplex | Not supported | Not supported |
| B2100/B2150 | 1Gbit/s, full duplex | Yellow solid | Green (with traffic) |
| B2100/B2150 | 10Gbit/s, half duplex | Not supported | Not supported |
| B2100/B2150 | 10Gbit/s, full duplex | Green solid | Green (with traffic) |
QSFP+ port LEDs behavior
The appearance and behavior of the 40GbE QSFP+ optical interface LEDs indicate network traffic activity, interface speed, and interface duplexity. There are two sets of LEDs for QSFP+ ports. One set is for operation in 40GbE, and the other set is for operation in 4 x 10GbE.
| Blade type | Link | Speed LED | Activity LED |
|---|---|---|---|
| B2250 | No link | Not lit | Not lit |
| B2250 | 40 Gbit/s, full duplex | Green solid | Green (with traffic) |
Transceiver module specifications
For current specification information for optical transceivers that are supported by this platform, see F5® Platforms: Accessories.
Cable pinout specifications
For current pinout information for this platform, see F5® Platforms: Accessories.
Always-On Management
The Always-On Management (AOM) subsystem enables you to manage the VIPRION® 2400 system remotely using serial console, even if the host is powered down. The AOM Command Menu operates independently of the BIG-IP® Traffic Management Operating System® (TMOS).


