Applies To:
Show Versions
BIG-IP GTM
- 11.6.5, 11.6.4, 11.6.3, 11.6.2, 11.6.1
Configuring Device-Specific Probing and Statistics Collection
Overview: Configuring device-specific probing and statistics collection
BIG-IP® Global Traffic Manager™ (GTM™) performs intelligent probing of your network resources to determine whether the resources are up or down. In some circumstances, for example, if your network contains firewalls, you might want to set up device-specific probing to specify which BIG-IP® systems probe specific servers for health and performance data.
About Prober pools
A Prober pool is an ordered collection of one or more BIG-IP® systems. BIG-IP Global Traffic Manager™ (GTM™) can be a member of more than one Prober pool, and a Prober pool can be assigned to an individual server or a data center. When you assign a Prober pool to a data center, by default, the servers in that data center inherit that Prober pool.
The members of a Prober pool perform monitor probes of servers to gather data about the health and performance of the resources on the servers. BIG-IP GTM makes load balancing decisions based on the gathered data. If all of the members of a Prober pool are marked down, or if a server has no Prober pool assigned, BIG-IP GTM reverts to a default intelligent probing algorithm to gather data about the resources on the server.
This figure illustrates how Prober pools work. BIG-IP GTM contains two BIG-IP Local Traffic Manager™ (LTM™) systems that are assigned Prober pools and one BIG-IP LTM system that is not assigned a Prober pool:
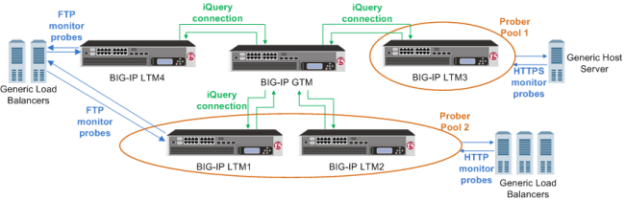
BIG-IP systems with prober pools
- Prober Pool 1 is assigned to a generic host server
- BIG-IP LTM3 is the only member of Prober Pool 1, and performs all HTTPS monitor probes of the server.
- Prober Pool 2 is assigned to generic load balancers
- BIG-IP LTM1 and BIG-IP LTM2 are members of Prober Pool 2. These two systems perform HTTP monitor probes of generic load balancers based on the load balancing method assigned to Prober Pool 2.
- The generic load balancers on the left side of the graphic are not assigned a Prober pool
- BIG-IP GTM can solicit any BIG-IP system to perform FTP monitor probes of these load balancers, including systems that are Prober pool members.
About Prober pool status
The status of a Prober pool also indicates the status of the members of the pool. If at least one member of a Prober pool has green status (Available), the Prober pool has green status.
The status of a Prober pool member indicates whether the BIG-IP GTM™ system, on which you are viewing status, can establish an iQuery connection with the member.
About Prober pool statistics
You can view the number of successful and failed probe requests that the BIG-IP® GTM™ system (on which you are viewing statistics) made to the Prober pools. These statistics reflect only the number of Probe requests and their success or failure. These statistics do not reflect the actual probes that the pool members made to servers on your network.
Prober pool statistics are not aggregated among the BIG-IP GTM systems in a synchronization group. The statistics on one BIG-IP GTM include only the requests made from that BIG-IP GTM system.
In this figure, the Prober pool statistics that display on BIG-IP GTM1 are the probe requests made only by that system.
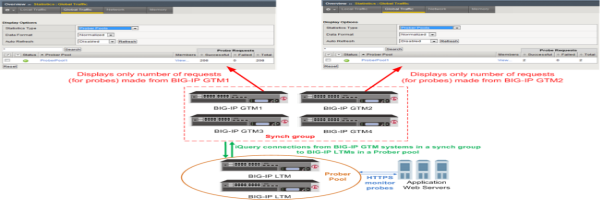
Prober pool statistics displayed per system
Task summary
Perform these tasks to configure device-specific probing and statistics collection.
Defining a data center
Defining a server
Creating a Prober pool
Assigning a Prober pool to a data center
Assigning a Prober pool to a server
Viewing Prober pool statistics and status
Determining which Prober pool member marked a resource down
Implementation result
You now have an implementation in which a specific BIG-IP® system probes the resources on a specific server, or the servers in a specific data center.


